For a related dataset, please see Fashion550k.
We collected a total of 144,169 posts to create a dataset to be able to create our models. The posts are distributed all over the world and allow us to get a glimpse of the state of global fashion. However, the data is not uniformly distributed as seen below in the density map.
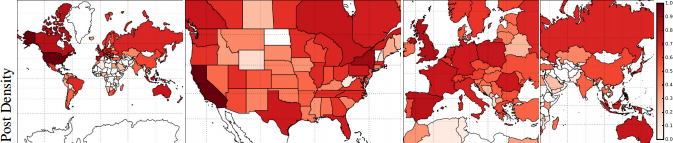 Density map of the
Fashion144k dataset. Darker colours indicate a larger amount of
posts in that location.
Density map of the
Fashion144k dataset. Darker colours indicate a larger amount of
posts in that location.
We use the votes given by users to each post as a proxy for the absolute fashionability of the post, which is something subjective that can not be directly measured. While this is not a perfect metric, it is something that allows us to teach a computer to rate and recommend fashion images. This opens up the possibility to automatic rating of outfit of the day posts, and having a personal fashion advisor in your cellphone.
We have run an analysis on the most fashionable cities in the dataset. While some results are surprising such as Manila having a very high mean fashionability, other results are in concordance to what one would think. Such as Los Angeles, Paris, New York or London being above average, and Barcelona being trendier than Madrid.
| City Name | Posts | Fashionability |
|---|---|---|
| Manila | 4269 | 6.627 |
| Los Angeles | 8275 | 6.265 |
| Melbourne | 1092 | 6.176 |
| Montreal | 1129 | 6.144 |
| Paris | 2118 | 6.070 |
| Amsterdam | 1111 | 6.059 |
| Barcelona | 1292 | 5.845 |
| Toronto | 1471 | 5.765 |
| Bucharest | 1385 | 5.667 |
| New York | 4984 | 5.514 |
| London | 3655 | 5.444 |
| San Francisco | 2880 | 5.392 |
| Madrid | 1747 | 5.371 |
| Vancouver | 1468 | 5.266 |
| Jakarta | 1156 | 4.398 |
We can also do a higher level analysis and try to relate the fashionability scores with country attributes such as the mean economy and income class, the Gross Domestic Product (GDP) and the population. It is interesting to see that sadly as expected, countries with more developed economies have larger fashionability scores. Also, in general, countries with larger populations score better on average.
| Attribute | Correlation | Interpretation |
|---|---|---|
| Economy class | -0.137 | Countries with stronger economies tend to have more trendy inhabitants. |
| Income class | -0.111 | Countries with higher mean income tend to have more fashionable inhabitants. |
| log(GDP) | 0.258 | Countries with higher Gross Domestic Product tend to have more trendy inhabitants. |
| log(Population) | 0.231 | Countries with larger populations tend to have more fashionable inhabitants. |
Citing
If you use this dataset, please cite
@InProceedings{SimoSerraCVPR2015,
  author    = {Edgar Simo-Serra and Sanja Fidler and Francesc Moreno-Noguer and Raquel Urtasun},
  title     = {{Neuroaesthetics in Fashion: Modeling the Perception of Fashionability}},
  booktitle = "Proceedings of the Conference on Computer Vision and Pattern Recognition (CVPR)",
  year      = 2015,
}